HOME > Investor Relations > Highlights
Investor Relations [Performance & Finances]
Highlights
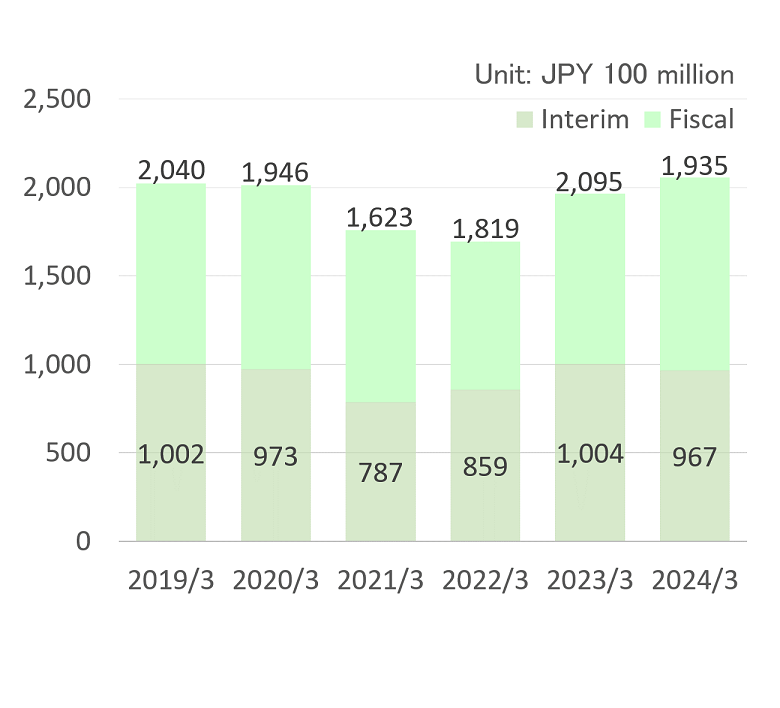
SALES
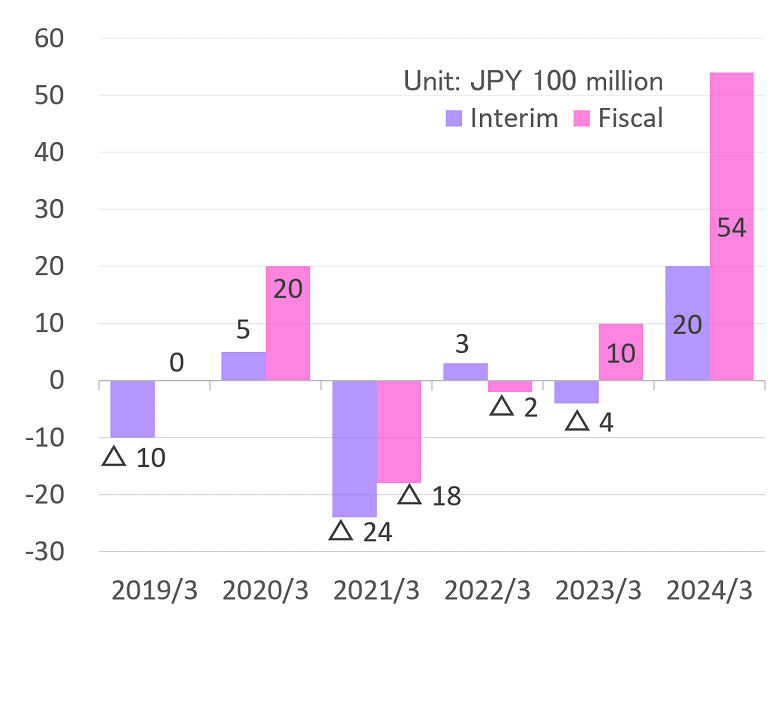
OPERATING INCOME
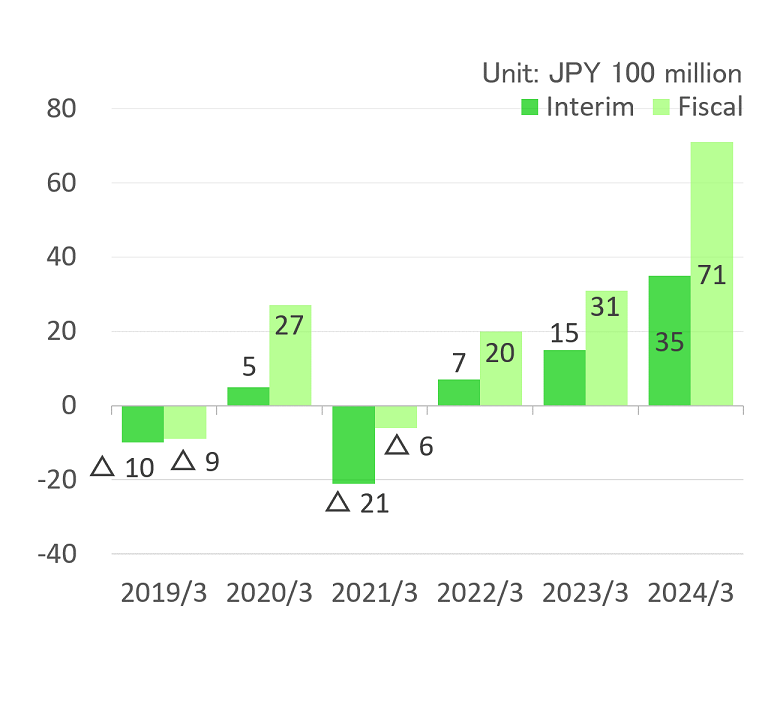
ORDINARY INCOME
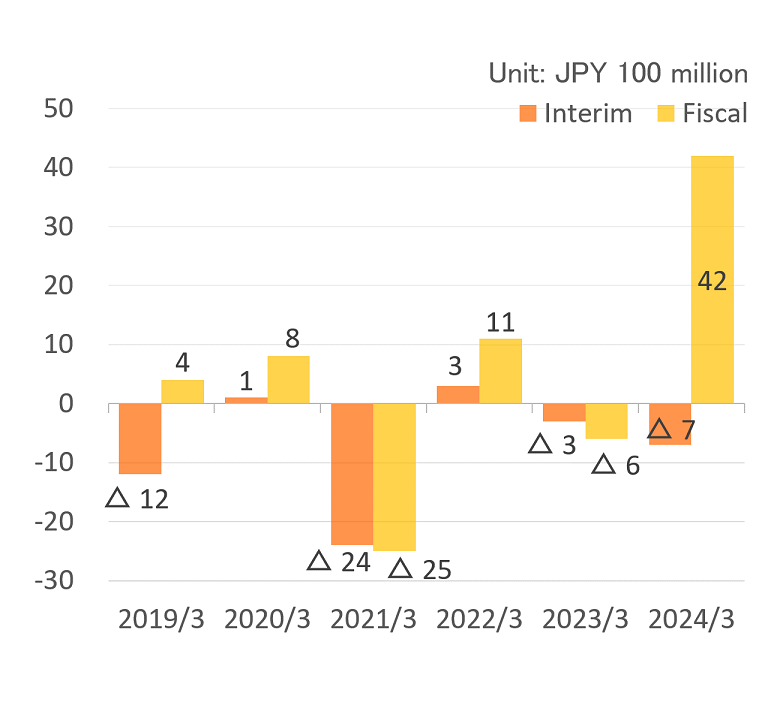
NET(LOSS)INCOME
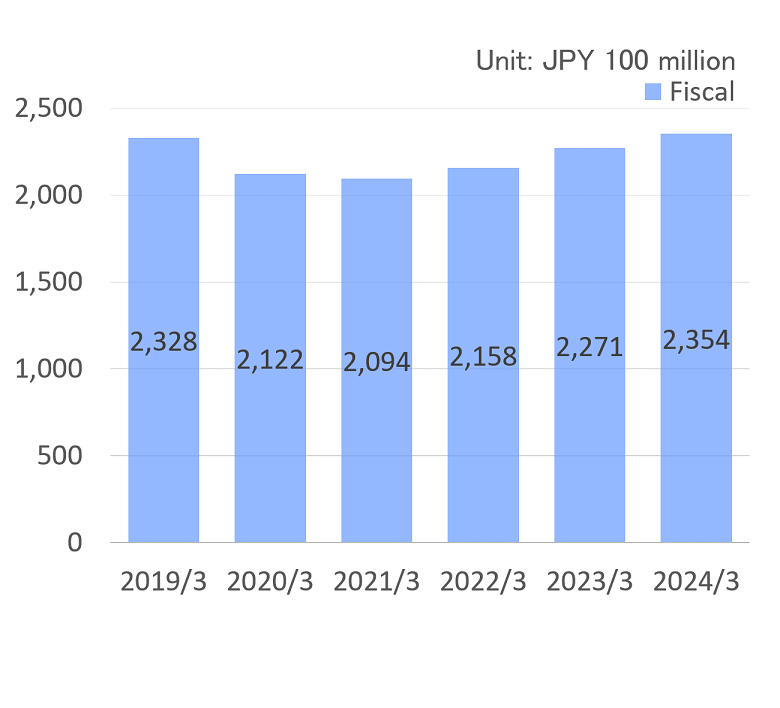
TOTAL NET ASSETS
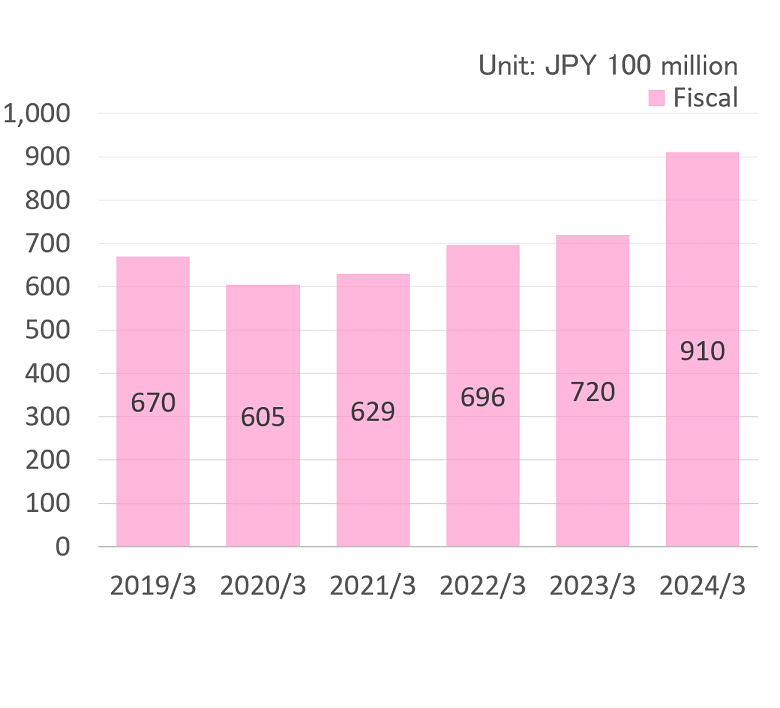
TOTAL ASSETS
Highlights(Consolidated)
| 2020/3 | 2021/3 | 2022/3 | 2023/3 | 2024/3 | 2025/3 | ||
|---|---|---|---|---|---|---|---|
| Sales (¥100 million) | Interim | 973 | 787 | 859 | 1,004 | 967 | 884 |
| Fiscal | 1,946 | 1,623 | 1,819 | 2,095 | 1,935 | 1,759 | |
| Operating Income (¥100 million) | Interim | 5 | −24 | 3 | −4 | 20 | 9 |
| Fiscal | 20 | −18 | −2 | 10 | 54 | 46 | |
| Ordinary Income (¥100 million) | Interim | 5 | −21 | 7 | 15 | 35 | 5 |
| Fiscal | 27 | −6 | 20 | 31 | 71 | 45 | |
| Net (loss) Income (¥100 million) | Interim | 1 | −24 | 3 | −3 | 16 | -2 |
| Fiscal | 8 | −25 | 11 | −6 | 42 | 43 | |
| Total Assets (¥100 million) | Fiscal | 605 | 629 | 696 | 720 | 910 | 853 |
| Total Net Assets (¥100 million) | Fiscal | 2,122 | 2,094 | 2,158 | 2,271 | 2,354 | 2,082 |
| Equity Ratio (%) | Fiscal | 28.5 | 30.0 | 32.2 | 31.7 | 38.6 | 40.9 |
| Ratio of Operating Income to Net Sales (%) | Interim | 0.5 | −3.0 | 0.3 | −0.4 | 2 | 1.1 |
| Fiscal | 1.0 | −1.1 | −0.1 | 0.5 | 2.8 | 2.6 | |
| Ordinary Income Ratio (%) | Interim | 0.5 | −2.7 | 0.8 | 1.5 | 3.6 | 0.5 |
| Fiscal | 1.4 | −0.4 | 1.1 | 1.5 | 3.7 | 2.6 | |
| Net (loss) Income Per Share (¥) | Fiscal | 18.0 | −56.7 | 24.6 | -13.0 | 95 | 99 |
| Dividends Per Share (¥) | Fiscal | 5.00 | 0.00 | 0.00 | 5.00 | 10.00 | 15.00 |
| Capital Investment (¥100 million) | Fiscal | 55 | 64 | 58 | 45 | 15 | 31 |
| Depreciation (¥100 million) | Fiscal | 98 | 90 | 85 | 83 | 77 | 64 |
| Interest-bearing Debt (¥100 million) | Fiscal | 1,019 | 979 | 923 | 992 | 844 | 718 |
| Employees | Fiscal | 3,676 | 3,579 | 3,384 | 3,171 | 2,832 | 2,720 |